The solar sector needs better data to adapt to climate change
If PV developers and investors want to ensure optimal performance and long-term resilience of their projects, they must adapt their strategies. The first step is to better understand the year-on-year variability of solar radiation. Now more than ever, it is crucial to work with the highest-quality solar and meteorological data to optimize both technical design and business planning. This is only possible with high-quality datasets – the foundation of well-functioning PV projects that can withstand the evolving impacts of climate change.
In the past, PV projects in development were often evaluated using simplified datasets. Twelve long-term monthly averages or hourly Typical Meteorological Year (TMY) data were considered sufficient. Thanks to systematic research and development over the past two decades, solar projects today can rely on high-quality satellite-based data capturing a history of 18 to 31 years, depending on the region.
This article explores solar radiation trends and how long-term, high-resolution datasets help secure both bankability and reliable performance.
Unique regional trends
Access to long historical time series data reveals that solar radiation patterns evolve differently across various geographies. A key side effect of climate change is the higher occurrence of extreme weather, driven by disturbances in atmospheric and hydrological cycles. The longer history of reliable data we have, the better we can identify evolving patterns and estimate the uncertainty of solar resources for the next two or three decades.
The deviation of yearly solar radiation from the long-term average is a natural phenomenon, mainly influenced by clouds and atmospheric aerosols, both of which are affected by weather variability and human activities. These natural processes are increasingly disrupted by human-induced climate change.
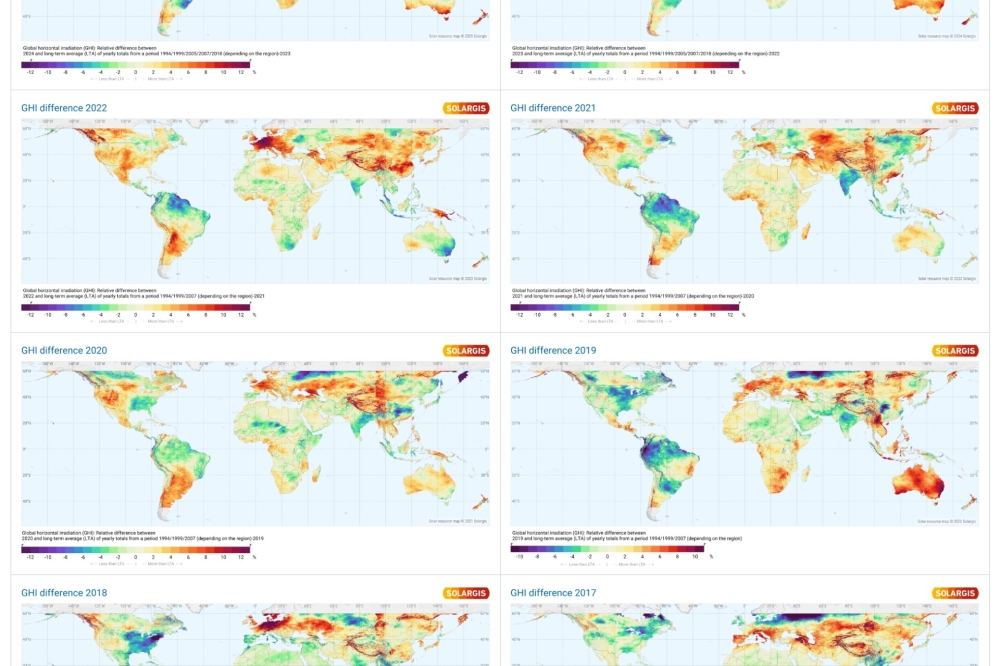
A map comparing the difference in Global Horizontal Irradiation (GHI) shows the geographic areas with higher solar radiation (orange-red colors) and lower solar radiation (blue-green colours) in 2024 compared to the long-term average.
Analyzing multi-decade datasets is essential to distinguish between natural weather fluctuations and human-induced trends. While the effects of rising temperatures are increasingly visible in historical data, the evolution of solar radiation is governed by more complex processes that remain less understood.
Maps showing annual GHI differences over the past eight years illustrate these changing geographic patterns. The longer the data record, the better equipped we are to understand solar resource availability.
High-quality historical data for accurate predictions
The bankability and financial viability of solar projects depend on accurate resource estimates. Yet many financial models still rely on datasets containing only long-term averages, such as Typical Meteorological Year (TMY).
TMY data excludes information on interannual variability and fails to capture yearly fluctuations in weather and solar radiation. As a result, investments based on TMY carry higher risks compared to those using time series datasets that reflect real weather variability and long-term changes.
A common misconception in the solar sector is that data from the last few years provides the most accurate representation of future conditions. Relying only on historical analysis of the last 10 to 15 years is a big mistake, as tempting as it might be. The limited analysis based on recent years’ data does not allow for understanding the climate cycles and long-term atmospheric trends. A limited historical record cannot fully capture the dynamism of clouds, aerosols, and pollution levels that shape future solar resource conditions.
Short-term datasets can therefore produce misleading signals that distort long-term projections by overemphasizing recent weather patterns or pollution states. It’s important to remember that both TMY and long-term averages (LTA) are simplified datasets that smooth out extremes. In particular, TMY eliminates variability, which can distort performance calculations. As a consequence, solar businesses relying on these datasets often face unexpected revenue losses when extreme weather occurs.
The most realistic view of future PV performance comes from time series data spanning two to three decades, with temporal resolution from one to fifteen minutes.
Using this type of sub-hourly data is the simplest way for the photovoltaic sector to prevent unpleasant surprises: the time series capture short term, seasonal and inter-annual fluctuations, which provide developers with the most accurate picture to develop robust power plant designs and conduct informed risk assessments.
Transitioning from TMY datasets to high-resolution time series data enables PV project investors and developers to protect their work against financial uncertainties derived from weather risks and climate change.
In a changing climate, prioritize long-history data
With climate change introducing new challenges to the solar power sector, rigorously validated datasets will become indispensable for accurate PV performance estimates. Data-driven decision-making is the only path toward resilient and financially secure projects. Developers who fail to use long-history, high-resolution datasets risk miscalculations of future climate conditions.
Leveraging time series data allows PV developers to distinguish between long-term statistical variability and actual climate trends. The result? Better-performing PV systems, long-term resilience, and optimized financial outcomes.